How To Access Kubernetes Dashboard Token
Before diving into the Kubernetes dashboard, just have a glimpse over what the heck is Kubernetes. Kubernetes is an open-source system automating application deployment, scaling, and management. It was originally designed by Google and is also recognized as K8s. The developers mainly utilize this tool to manage the containers across the public, private cloud environment. With the private cloud environment, we meant that cloud deployment is where you maintain your own servers and infrastructure that mainly hosts your applications and the data as well.
Uses of Kubernetes Dashboard
The dashboard provides an overview of the pods/clusters that runs on your machine. Moreover, it tells the creation and modification of individual Kubernetes resources, eg. deployments, jobs, etc. It provides accurate information on the state of Kubernetes resources in your cluster, and on any errors that may have occurred.
$ kubectl apply -f https://raw.githubusercontent.com/kubernetes/dashboard/v1.10.1/src/deploy/recommended/kubernetes-dashboard.yaml
The above command is used to connect the dashboard. Wait for Kubernetes-dashboard-x pods to goes "Running" status.
Once the Kubernetes-dashboard-x container goes to the "Running" state, then we can initiate kubectl proxy with the below-given command. If you want to start only in localhost then you can change the address option to the localhost.
$ kubectl proxy --address=0.0.0.0
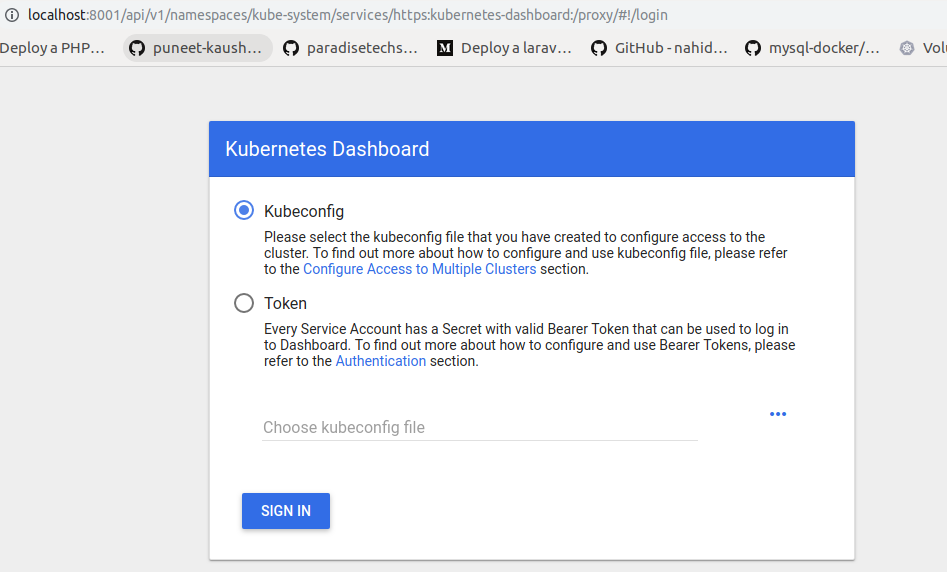
Now open the below Kubernetes dashboard URL in a browser.
http://localhost:8001/api/v1/namespaces/kube-system/services/https:kubernetes-dashboard:/proxy/.
The given link will direct you to the Kubernetes dashboard. Here, to build a connection we need a token (key). And the key will be explained to you by the below commands.
To login properly into the Kubernetes dashboard, we need to create a service account and assign the proper role.
$ kubectl create service account dashboard -n default
$ kubectl create clusterrolebinding dashboard-admin -n default --clusterrole=cluster-admin --serviceaccount=default:dashboard
Now the password to login to the Kubernetes dashboard can be viewed by running the below command. Copy the decoded password and login into the dashboard.
$ kubectl get secret $(kubectl get serviceaccount dashboard -o jsonpath="{.secrets[0].name}") -o jsonpath="{.data.token}" | base64 --decode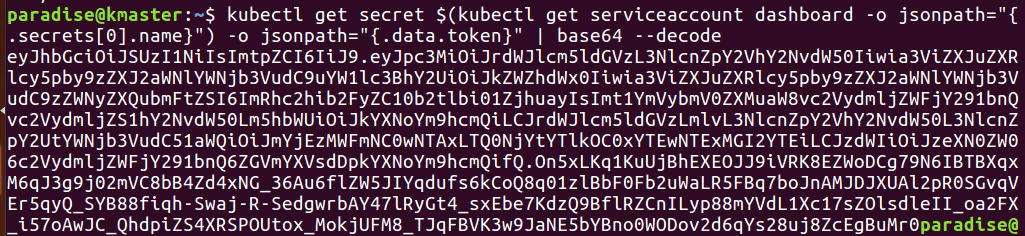
After putting the above command we’ll attain a token key for access to the Kubernetes dashboard.
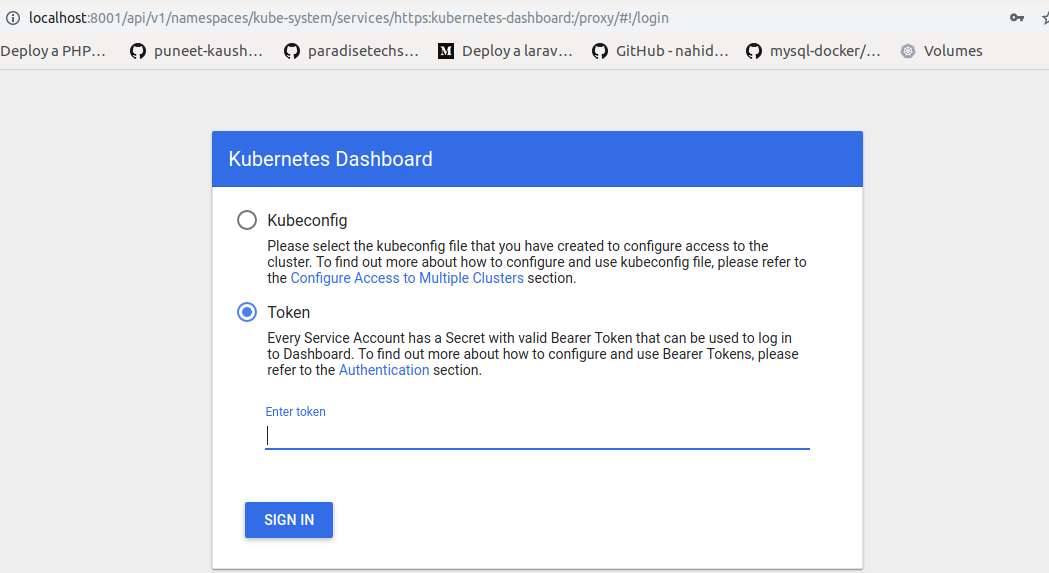
As mentioned in the below screenshot, that shows you to opt from those 2 options, i.e. Kubeconfig & Token. We prefer you to select a token, and insert the key and proceed with the sign-in process.
After the sign-in, it will show you the dashboard main page. On that page, we can see the node’s running stage, replicas, clusters, etc., and every action that we perform on a created object. It helps us to visualize every action of master and node.

kubeadm token
Bootstrap tokens are used for establishing bidirectional trust between a node joining the cluster and a control-plane node. The token generated is valid only for 24hours. In that case, the 24 hours exceed we need to generate the new token using the command:
$ sudo kubeadm token createThe current token can be the view from the master using the below command.
$ sudo kubeadm token list
We have described the flannel that is used for the communication process and after the flannel network is deployed, we can verify the flannel interface for the IP address assigned.
Bottom Line
In a nutshell, Kubernetes is an open-source system automating application deployment, scaling, and management. It was originally designed by Google and is also recognized as K8s. Further, we will come back with part of this Kubernetes series. Till then enjoy learning and we hope this second section prompts you through your Kubernetes journey.

Comments
Post a Comment